


BITCOIN ROAD MAP 2025 Feb 15 2025
Today we are providing what we believe is the road map for Bitcoin in the coming months.


Crypto Rank #1: Bitcoin (BTCUSD)
The analysis in this writeup assumes that the current all-time high (109,312) at the time of this writing will not be exceeded. If it is exceeded, this invalidates this analysis.
Higher Level Technical Analysis
We start by looking at the daily chart of Bitcoin.

Three things stand out, which are shown on the chart below.
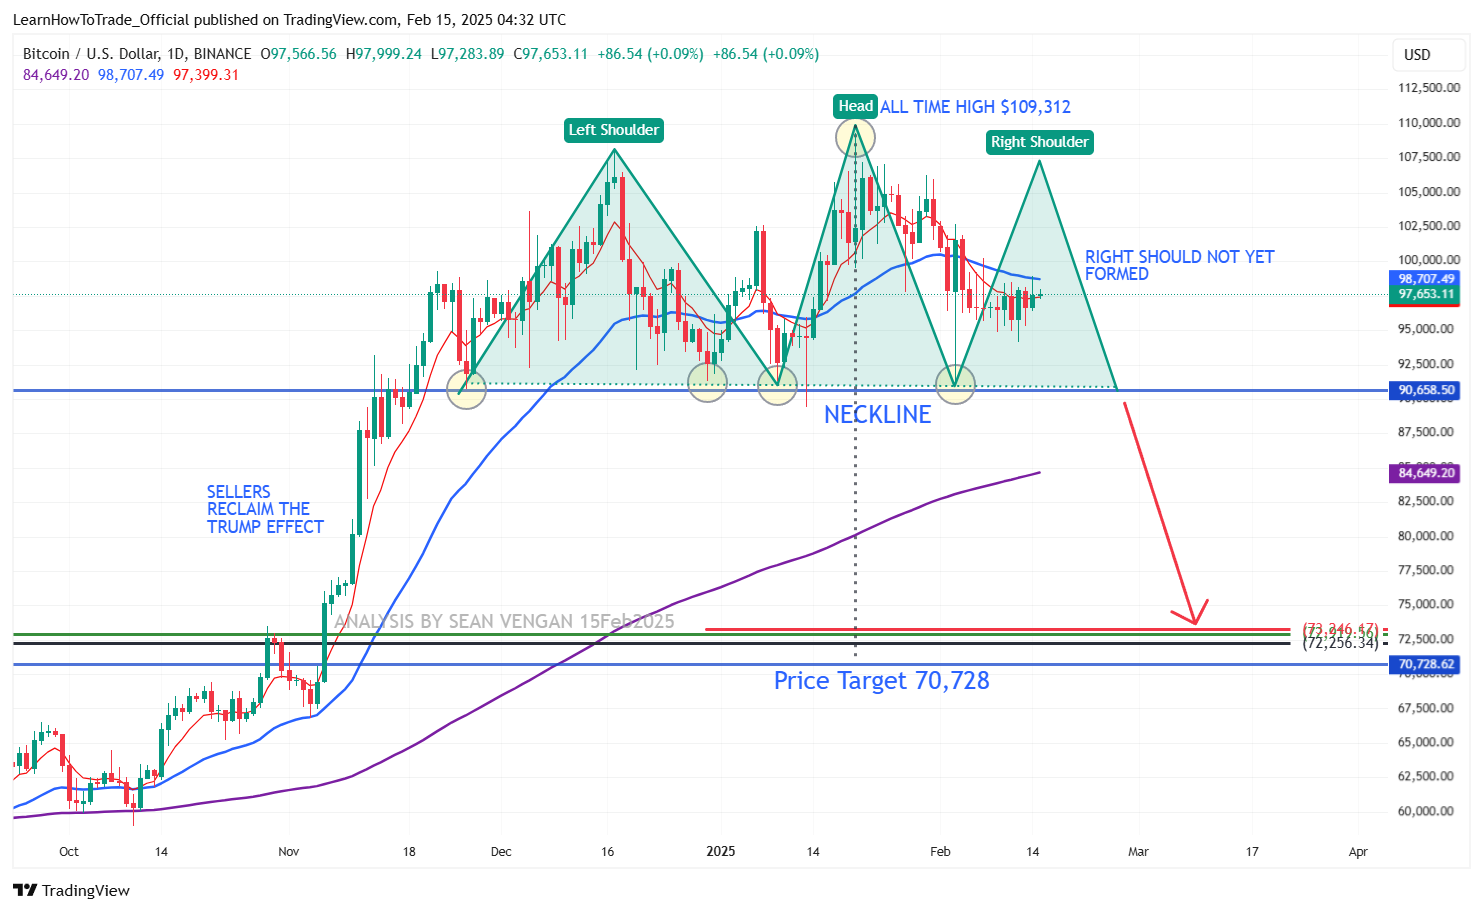
First is the explosive move, arguably caused by the “Trump Effect," when Trump was winning the last US presidential election. Donald Trump has openly endorsed cryptocurrency on his campaign trail and is keen on setting up a Bitcoin Reserve as a measure to stave off US bankruptcy and remove the burdensome debt that has accumulated into trillions as a result of past US fiscal policy.
Second, this explosive move culminated in an all-time high of 109,312, which has some significance, as I will explain shortly.
Third is the consistent support found at around slightly above 91,000.
Here’s how it looks when we mark this up on the Bitcoin chart.

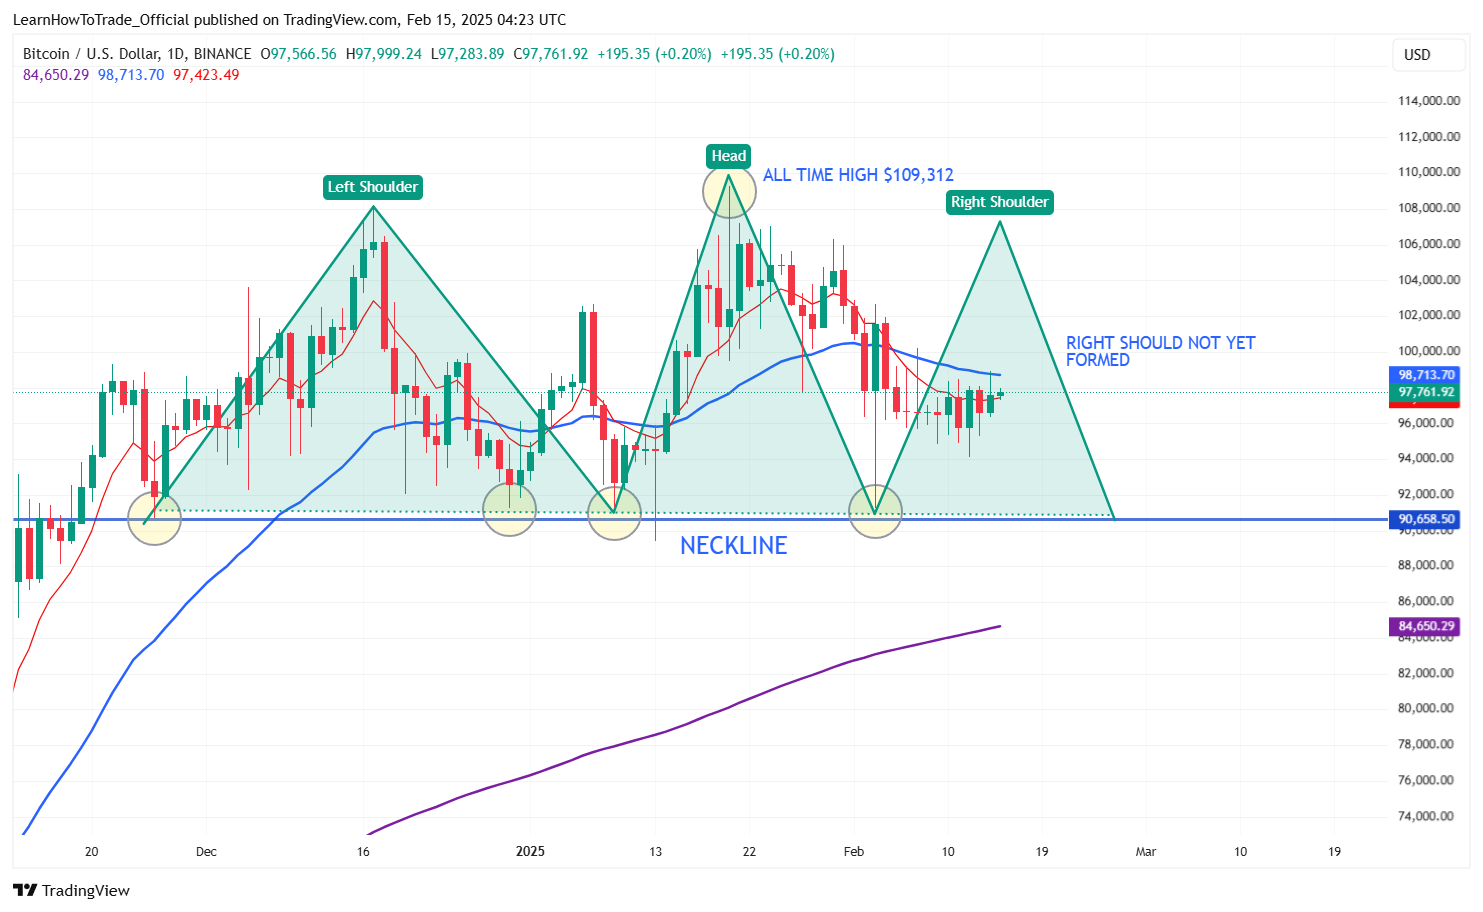
Potential Head and Shoulders Developing
Taking this further, we notice the potential for a Head and Shoulders pattern in the making, which can have two interpretations, both of which aren’t particularly clean.
In both cases, the right shoulder is still to develop and therefore remains to be seen whether these two Head and Shoulder patterns play out.
Head and Shoulders: Interpretation 1

Head and Shoulders: Interpretation 2
Assumption: Bitcoin Has Already Peaked
Suspending all preconceived notions that Bitcoin is “going to the moon” and wild expectations of how high it will go, let’s make an assumption: for now, that Bitcoin has already made it’s all-time high and it won’t be exceeded, at least in the short term.
Assuming the Head and Shoulders formation plays out, we can then project a range from the peak of the high to the base of the neckline, and using that range, project down from the neckline.
In other words, should the Head and Shoulders formation be confirmed and the neckline be broken, we have a sell price target where Bitcoin might fall to, and that figure comes out at 70,728.

Fibonacci Support
Combining this price target with our Fibonacci analysis, we start seeing that a realistic downside target between 70,728 and 73,246 is possible. If you look left, this would reclaim the price spike caused by the US Elections and the “Trump Effect.”.
So in summary, the following conditions need to be met for this Bitcoin roadmap to play out:
The current all-time high is not exceeded
The right should develop to form a Head and Shoulders pattern.
The neckline is broken, and the price continues going down.
If all of these three things occur, a price target of between 70,728 and 73,246 is our sell target.
Crypto Gainers/Losers
Top Gainers and Losers (%) in the last 24 hours.

Crypto Bitz-Size News
The U.S. Attorney’s Office announced that it collected a record-breaking $1.5 billion in criminal actions for Fiscal Year 2024, with the majority coming from a settlement with cryptocurrency exchange Binance
Bitget obtains Bulgarian virtual asset licence in EU expansion move
Crypto Trivia Quiz
What is a smart contract??
Find out the answer at the bottom of this newsletter 😉
Crypto Memes

Trivia Answer:
A self-executing agreement with terms written in code. 🎉